JCuda kernel launch performance

I wonder whether anyone else has looked at the JCuda kernel launch performance in detail. I have a stream application where fast kernel launch is essential. I have tested the JCuda Runtime and Driver kernel launch performance and found that the runtime launch is mush slower than the driver but there are other interesting factors. The attached picture shows the runtime vs driver vs native CUDA kernel launch times. Note how the JVM optimization kicks in after few hundreds samples (needs more for the driver, interestingly). The driver launch is close to native performance but what really troubles me is the extreme variance of the call times with many values in the order hundreds of microseconds.

Statistics for EMPTY kernel call, time in microseconds (windows 7, JDK 1.8.0_92, core i7 2.7GHz, CUDA 7.5, jCUDA 7.5):

Did anyone experience the same behaviour?

thanks,
Zoltan

1 „Gefällt mir“

Wow, thanks for this detailed analysis!

Admittedly, I have never analyzed all possible overheads systematically and in this depth. Although I considered it as interesting, I always resorted to two arguments:

  1. In most cases, kernel execution should be the dominating factor.
  2. There is not so much room for improvements (technically)

Regarding 1: The kernel is where the actual work happens, and things like the windows timeout and recovery (TDR) usually seemed to be a larger problem than a few microseconds of launch overhead. But I always expected that there might be usage patterns where even the smallest overhead might accumulate and turn out to be costly. And I see that your application may be such a case…

(I rather expected this to happen for memory copies. I once wrote a small test (far away from a “benchmark”) for JOCL, which internally works similar to JCuda, and noticed that 10 million “empty” memory copies in C basically took no time, whereas in Java/JOCL, one had to wait for a while…)

Regarding 2: JCuda is a very thin layer around CUDA. It just forwards the calls through JNI. The conversions of the arguments are in most cases just plain casts, except for pointers - but these only involve one access to a field of the Pointer class, and this should be negligible.


In any case: There always will be some overhead. The questions are: How large is it? And: How relevant is it?

I’m currently trying to make sense of your figures. It’s interesting to see when the JIT kicks in. And I would find it interesting to either see a comparison of the numbers for the part after the JIT has run, or the numbers that result from starting it with something like

java -server -XX:CompileThreshold=1 ...

But I also have to admit that what currently confuses me most about the test/diagram in general is the “JCuda runtime kernel call” part in general: It’s actually not possible to call kernels with the JCuda runtime API.

Would you mind to share the code that you used for the actual tests?

Maybe this also helps (me and possibly others) to figure out where the 100s-milliseconds delays might come from. My first (vague and wild) guess is that it could be related to garbage collection - but of course, this heavily depends on how exactly you measured the time. (Using System.nanoTime(), or CUDA events?). Adding -verbose:gc to the command line might already help to rule this out.


EDIT: I forgot to mention another factor that I’d find interesting, namely, how many and which types of parameters you passed to the “empty” kernel. Maybe this is implicitly answered when you share the code. But even some rough summary about the test setup would be helpful.

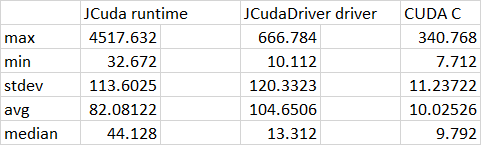
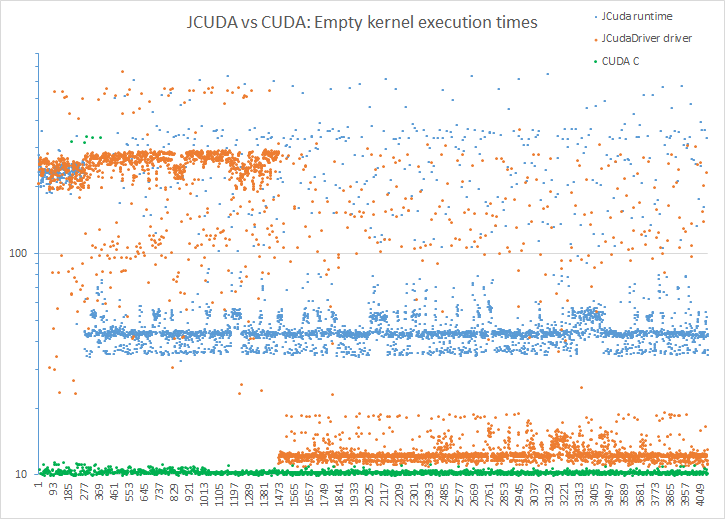
Marco, thanks for the very quick response. As you say, there will always be overhead, that is fine. What would be nice to find is the root cause of the large variance. My first suspect is GC but indeed that requires more tests. By Runtime kernel call, I really meant the KernelLauncher, sorry for the confusion.

This is the driver API code I used for the tests.

void emptyKernel(int samples) {
    CUevent eventStart = new CUevent();
    CUevent eventStop = new CUevent();

    JCudaDriver.cuEventCreate(eventStart, CUevent_flags.CU_EVENT_DEFAULT);
    JCudaDriver.cuEventCreate(eventStop, CUevent_flags.CU_EVENT_DEFAULT);
    int blockSizeX = 512;
    int gridSizeX = 128;
    // Load the ptx file.
    CUmodule module = new CUmodule();
    JCudaDriver.cuModuleLoad(module, "your_kernel.ptx");

    CUfunction kernel_function = new CUfunction();
    JCudaDriver.cuModuleGetFunction(kernel_function, module, "empty");
    // call kernel
    for (int i = 0; i < samples; i++) {
        JCudaDriver.cuEventRecord(eventStart, null);
        cuLaunchKernel(kernel_function,
                gridSizeX, 1, 1, 
                blockSizeX, 1, 1,
                0, null, // Shared memory size and stream 
                null, null // Kernel- and extra parameters
        );

        JCudaDriver.cuEventRecord(eventStop, null);
        JCudaDriver.cuEventSynchronize(eventStop);

        float[] ms = new float[1];
        JCudaDriver.cuEventElapsedTime(ms, eventStart, eventStop);
        System.out.println(ms[0] * 1e3 + " usec");
    }
} 

Kernel code is just a simple kernel, please add to your .cu file and compile to .ptx:

extern "C"
__global__ void empty()
{
    int x = threadIdx.x;
}

The runtime version is similar. By runtime I really meant the event call methods plus the KernelLauncher. As you see, in the code I used a parameter-passing version in my test - now replaced by call() - but that might not influence the time variance that much (I hope).

void emptyKernelRuntime(int samples) {
    KernelLauncher kernelLauncher = 
            KernelLauncher.create("your_kernel.cu", "empty", "-arch sm_30");
    kernelLauncher.setGridSize(128, 1, 1);
    kernelLauncher.setBlockSize(512, 1, 1);
            
    cudaEvent_t eventStart = new cudaEvent_t();
    cudaEvent_t eventStop = new cudaEvent_t();
    JCuda.cudaEventCreate(eventStart); 
    JCuda.cudaEventCreate(eventStop);
    
    JCuda.cudaEventRecord(eventStart, null);
    //kernelLauncher.call(dev_result, dev_coeffs, dev_buffers, position);
    kernelLauncher.call();
    JCuda.cudaEventRecord(eventStop, null);
    JCuda.cudaEventSynchronize(eventStop);
    
    float[] ms = new float[1];
    JCuda.cudaEventElapsedTime(ms, eventStart, eventStop);
    System.out.println("\t" + ms[0]*1e3 + " usec");
}

I hope this helps in reproducing the results. I will continue checking some JVM parameters effects in the meantime.

Zoltan

EDIT by Marco13: Fixed formatting

I have forgot to put in the for loop into the Runtime version. Also attaching the CUDA/C version

dim3 grid(128,1,1);
dim3 block(512, 1, 1);
for (int k = 0; k < NUM_SAMPLES; k++) {	

	cudaEventRecord(start);
	empty<<<grid,block>>>();
	cudaEventRecord(stop);
	cudaEventSynchronize(stop);

	cudaEventElapsedTime(&time, start, stop);
	printf("%.8f\n", time*1e3);
}

Zoltan

First of all: The KernelLauncher class is only intended as a convenience/utility class. When you look at the implementation of the call method, you can see that it basically does nothing else than determining the kernel parameters from the varargs array, and doing a kernel call with the plain driver API. Although this should also be a relatively small overhead, it is not “necessary”, and can be avoided (by directly using the driver API), saving a few if/instanceof checks and the array allocation for the varargs call.

(And a side note: The KernelLauncher now is a tiny bit more convenient than the manual kernel call with the driver API. But it was originally created for earlier CUDA versions, where the kernel argument setup involved several calls to cuParamSetf/i/v with strict alignment requirements - this was tedious and error-prone, and the KernelLauncher really simplified this. Fortunately, they simplified the driver API in this regard - I think in CUDA 4.0)


Regarding the actual test: I’m not sure where these significant delays of hundreds of microseconds should come from. Most importantly: When using the CUevent objects for measuring, then these times should actually not include anything that is done on Java side …

At least, I just ran this program (Windows 8.1, JRE 1.8.66, CUDA 8, JCuda 0.8.0)

package jcuda.driver.test;

import static jcuda.driver.JCudaDriver.cuCtxCreate;
import static jcuda.driver.JCudaDriver.cuDeviceGet;
import static jcuda.driver.JCudaDriver.cuEventCreate;
import static jcuda.driver.JCudaDriver.cuEventElapsedTime;
import static jcuda.driver.JCudaDriver.cuEventRecord;
import static jcuda.driver.JCudaDriver.cuEventSynchronize;
import static jcuda.driver.JCudaDriver.cuInit;
import static jcuda.driver.JCudaDriver.cuLaunchKernel;
import static jcuda.driver.JCudaDriver.cuModuleGetFunction;
import static jcuda.driver.JCudaDriver.cuModuleLoad;

import java.util.DoubleSummaryStatistics;

import jcuda.driver.CUcontext;
import jcuda.driver.CUdevice;
import jcuda.driver.CUevent;
import jcuda.driver.CUevent_flags;
import jcuda.driver.CUfunction;
import jcuda.driver.CUmodule;
import jcuda.driver.JCudaDriver;

public class JCudaKernelLaunchOverheadAndPerformance
{
    public static void main(String[] args)
    {
        JCudaDriver.setExceptionsEnabled(true);
        cuInit(0);
        CUcontext pctx = new CUcontext();
        CUdevice dev = new CUdevice();
        cuDeviceGet(dev, 0);
        cuCtxCreate(pctx, 0, dev);

        emptyKernel(10000);
    }

    static void emptyKernel(int samples)
    {
        CUevent eventStart = new CUevent();
        CUevent eventStop = new CUevent();

        cuEventCreate(eventStart, CUevent_flags.CU_EVENT_DEFAULT);
        cuEventCreate(eventStop, CUevent_flags.CU_EVENT_DEFAULT);
        int blockSizeX = 512;
        int gridSizeX = 128;
        
        // Load the ptx file.
        CUmodule module = new CUmodule();
        cuModuleLoad(module, "empty.ptx");

        CUfunction kernel_function = new CUfunction();
        cuModuleGetFunction(kernel_function, module, "empty");
        
        float[] ms = new float[1];
        DoubleSummaryStatistics d = new DoubleSummaryStatistics();
        
        // call kernel
        for (int i = 0; i < samples; i++)
        {
            cuEventRecord(eventStart, null);
            cuLaunchKernel(kernel_function, 
                gridSizeX, 1, 1, 
                blockSizeX, 1, 1,
                0, null, // Shared memory size and stream
                null, null // Kernel- and extra parameters
            );

            cuEventRecord(eventStop, null);
            cuEventSynchronize(eventStop);

            cuEventElapsedTime(ms, eventStart, eventStop);
            d.accept(ms[0] * 1e3);
        }
        System.out.println("min "+d.getMin());
        System.out.println("max "+d.getMax());
        System.out.println("avg "+d.getAverage());
    }
}

and the output for me is

min 4.800000227987766
max 10.143999941647053
avg 4.8687263248953965

(I don’t think that the CUDA version, 7.5 vs. 8.0, should make a difference here - but maybe you can try out the above program, or try to explain which times are actually shown in the above diagram…)

I ran your code on v7.5 and got the following numbers

min 8.031999692320824
max 10.591999627649784
avg 8.411484226598986

These are actually better results than the native CUDA kernel launch figures. See red values in the attached plot.

I then executed my code and got similarly good results. I cannot explain how the behaviour and results changed so radically. Could the JCuda initialisation influence it? I will continue tracking down this issue but I am more than happy with the current outcome, especially seeing your sub 5 microsecond launch times.

Again, I’m not entirely sure what was shown in your initial diagram: The time that is reported with the CUevent objects should be independent of the Java part. I assumed that you did roughly something like

long before = System.nanoTime();
// launch kernel, and synchronize (!)
long after = System.nanoTime();
double us = (after-before)/1e3;

But note that it will be very difficult to obtain reliable results here. (At least, this could have explained the JIT effect, but that was all just based on guesses).

Can you say more precisely how you measured these times?

In any case: Of course, the overall time for a kernel launch cannot be smaller in JCuda than in CUDA, so … something must be odd there :wink: